Empathy & definition

UX research can be boiled down to empathizing with users to help define problems. Primarily, asking people questions or observing them for into insights to help understand and solve problems. The discovery phase contains activities aimed at gathering data from users and about the problem space with which you are dealing.
Building empathy with, and understanding of, users is the single most important aspect underpinning all user experience work. The rest of this section covers some common types of (and purposes for) user research, tips for doing UX research, and some typical research outputs for sharing with project teams and stakeholders.
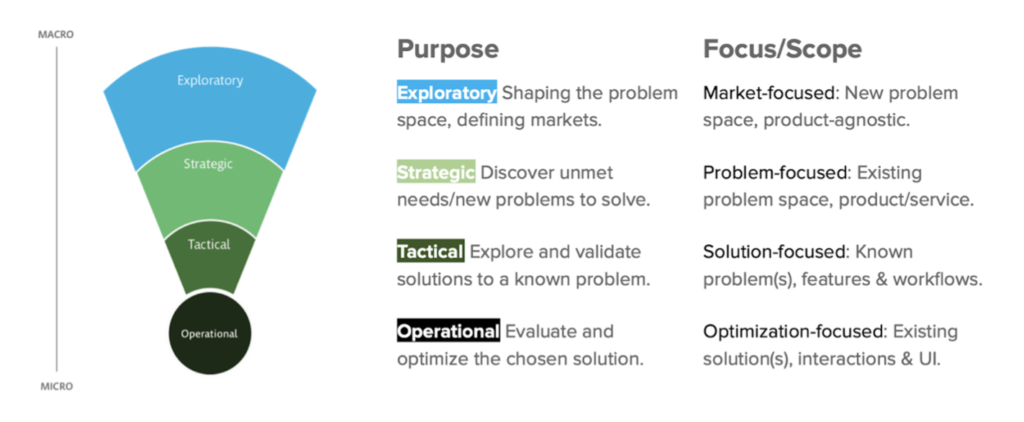
Most UX research will fall into two main buckets, generative (typically at the beginning stages of new work) or evaluative (typically during, or at the end of a project to confirm assumptions or design direction). Unless you are redesigning an existing product, most of the research in the discovery phase will be generative.
Generative Research
Understanding new problems or unmet needs and defining opportunities; the kind of research we typically do at the beginning stages of new work.
Example methodologies — collaborative workshops, analytics analysis, content prioritization, open card sorts, surveys, interviews, ethnographic studies, personas & journey maps.
Evaluative Research
Validating potential solutions to known problems; primarily about confirming assumptions, and is the kind of research that is often iterated upon and repeated during a project.
Example methodologies — closed card sorts, tree tests, expert evaluation, a/b & multivariate tests, first clicks, task completion tests, usability tests
For the most part, unless we are redesigning an existing product, most of the research in the discovery phase will be generative. Evaluative research most often happens when we want to test design assumptions with users.
When to do Research
Ideally, we should always be doing some level of research to understand business / user needs (generative), to make project or operational design decisions (generative, evaluative) and to baseline and measure improvement in products (evaluative).
Methodology Matrix: What & Why
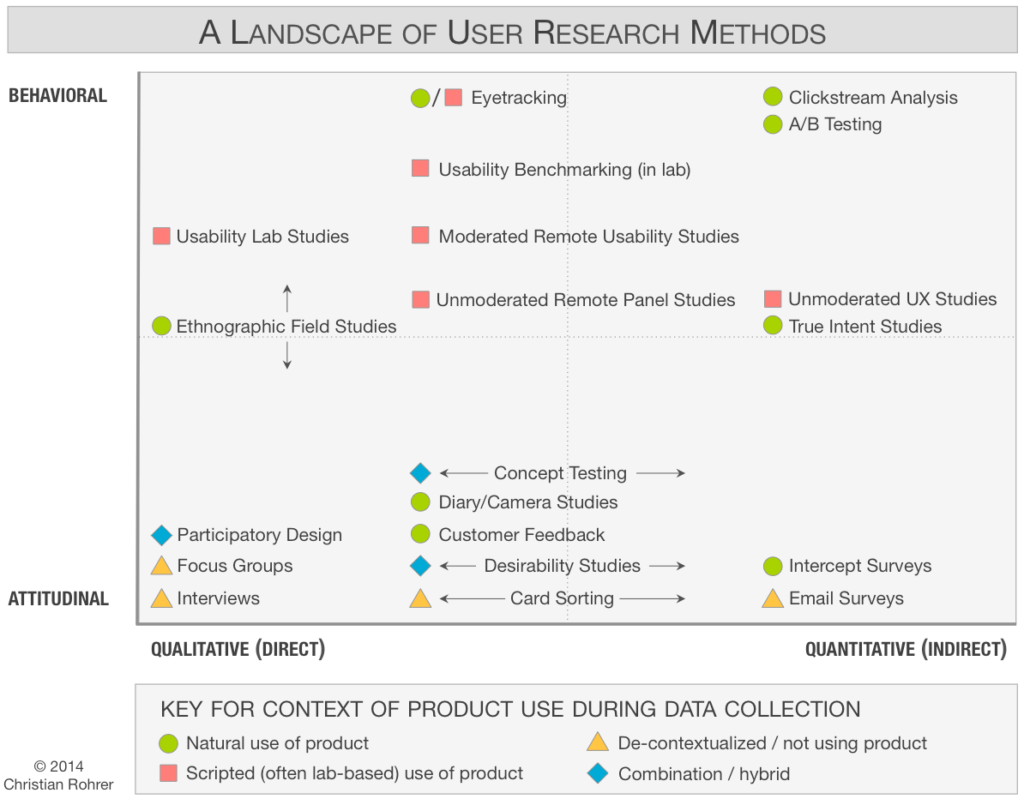
The following image from NN/g provides some useful suggestions for methodologies, based on an XY axis of data being sought.
In Short
The list below has significant crossover between the x and y axis (and context drives methodology), but in general these are examples of how to acquire various types of data. For example, surveys can provide both qualitative and quantitative data, depending on how they’re written.
- Attitudinal – what users say/feel
interviews, workshops, surveys - Behavioural – what users do
field studies, usability testing - Quantitative – numerical/statistical
A/B tests, surveys - Qualitative – opinion/feelings
interviews, card sorts, tree tests, preference tests
This is not meant to be a comprehensive guide, but user research isn’t rocket science either. While we’ll be happy to help you out, if you do decide to conduct user research on your own, the following is a simple, high-level approach that can help you stay on track and have success.
Have clear objective(s) and research questions
Sometimes called a problem statement, define your research objective(s) upfront. Be clear about what you are researching and why, and the larger questions you want to answer to meet your objective(s). On smaller studies, like usability testing a prototype or preference testing design treatments, research questions are often not necessary.
** Note: research questions are not ones you directly ask study participants. Rather, they are purposely broad, and should directly address the problem stated in your objective.
Review external and secondary data (if applicable)
If available or appropriate, look at / include external sources of data for information to help you frame your research:
- competitive analysis (similar products with similar customers)
- analytics or previous/baseline research on your own product
Choose a methodology
Determine what kind of data you want and what kind of methodology you need to acquire it. It’s crucial to understand what you’re trying to achieve and using the right tool to achieve it. That’s where we can help.
Write a research plan / brief
Even if it’s very simple, a research plan or brief should be included in any sizeable effort. Even if all you want to do is interview or survey people, sometimes writing a brief can be very helpful in cases of significant ambiguity. This is important when you need to tell others about your research, particularly when you need stakeholder buy-in, or when you’re reporting out results.
Conduct the study
This is not a “how to” guide on doing research, however, some considerations:
- Some research will be simple and can be conducted completely via web intercept and online unmoderated activities.
- Some research will require participant recruitment (including screeners), informed consent and release, compensation, space, technology choices and other considerations.
- Doing (particularly moderated) research can be time consuming. Having said that, for most qualitative studies, five participants will give you 80% of the issues you can find. In contrast, quantitative research relies on volume; the more participants, the better.
- When planning your research, ensure you’ve covered all your bases and will have the necessary considerations (and back-up plans) in place. For direct/moderated research, running the sessions is really a two-person job.
For lots of good tips on planning and conducting UX research, look at Just Enough Research, an excellent resource for fast, usable research methodologies and tips.
Analyze data and present findings
For quantitative data, most modern research tools will give you results with graphs and numbers already calculated, and you can often export them as PowerPoint decks or PDF slideshows for easy presentation.
For qualitative data, you’ll need to transcribe and interpret. Just ensure you leave time for this, as it can take longer than expected. It’s also a process that’s very susceptible to bias since you often really want to confirm your feelings.
Analyzing qualitative textual/video data is much too big a topic for this space, but it typically involves tagging and theming passages of text. There are many applications that can help you do this and even act as repositories to make your research data more accessible and usable.
**Note: However you analyze the data, be sure to tie findings back to your main research questions so that you meet the objective(s) of your study. Also, make sure you present it in a way that works for your intended audience.
So, we’ve done surveys and interviews, collected feedback, conducted tests, maybe even run a workshop and themed issues, and have all kinds of data. Now what? What kind of things can we produce to build customer empathy and problem understanding within project teams and with stakeholders? Below are a few common outputs to help build understanding.
All of the following can be achieved through interviews and/or workshops. Talk to us about facilitating a UX workshop if you’d like to better understand your customers and their issues, or if your project needs a kickstart.
Note: The order below is a suggested approach, if personas and journeys are your ultimate goal. However, obviously these pieces can be produced as one-offs, depending on what your project/product needs.
User Stories
User stories are key output of research activities to help you understand their goals and frustrations. You can use most research methodologies to elicit user stories, which really just describe what a user needs to do to accomplish a certain goal (or problems they are having), in a specific context. Several workshop formats are really good ways to collect or write user stories. There are minor variations, but in general user stories are written in the following format:
As a <user role / persona>, I need to <do task> so that I can <accomplish goal>.
In the case of UX research, user stories can also be framed as frustrations or issues with a given product or service. Regardless of their purpose, the most common way to collect user stories is through ongoing feedback mechanisms, interviews, open-ended surveys, or workshops. They can be very useful for creating personas, customer journeys, or even just articulating a problem or issue.
Empathy Maps
A empathy map is collaborative visualization used to articulate what we know about a particular type of user. Its primary purpose is empathy and understanding, and typically goes hand-in-hand, prior to creating a persona and its journey. A workshop with (digital or physical) whiteboard, stickies and stakeholders or real users is all you need to create one.
Typical Empathy Map Format:
- 4 quadrants centred on a user or persona
- Says – actual quotes, attitudes
- Thinks – extrapolation, verbal (or diary)
- Does – actions, behavioural
- Feels – extrapolation, emotional (or diary)
Affinity Diagrams
Much like an empathy map, an affinity diagram is a visualization of issues, usually on cards or post-it notes. Where they differ is that an affinity diagram, rather than focusing on a person or persona, is focused on the relationships between unstructured pieces of data. Empathy maps help us understand customers/users, whereas affinity diagrams help us define problems and potential solutions.
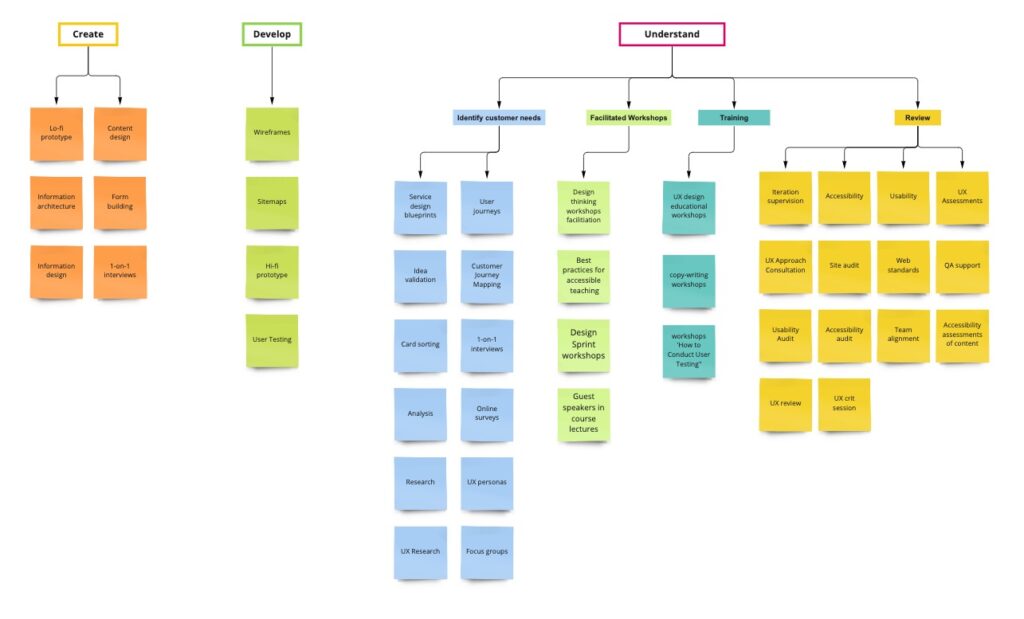
An affinity diagram is a cluster map, where cards/post-its containing issues, ideas, user stories and other fragments, are grouped into insights or themes. They can be very useful at the earliest stages of a project to help stakeholders align on problems or goals.
Personas
Personas are fictional customer archetypes based on real data. They help you build empathy and understanding of customers when designing products and services for them. User stories, empathy maps, interviews and even surveys can all be used to collect data for producing personas.
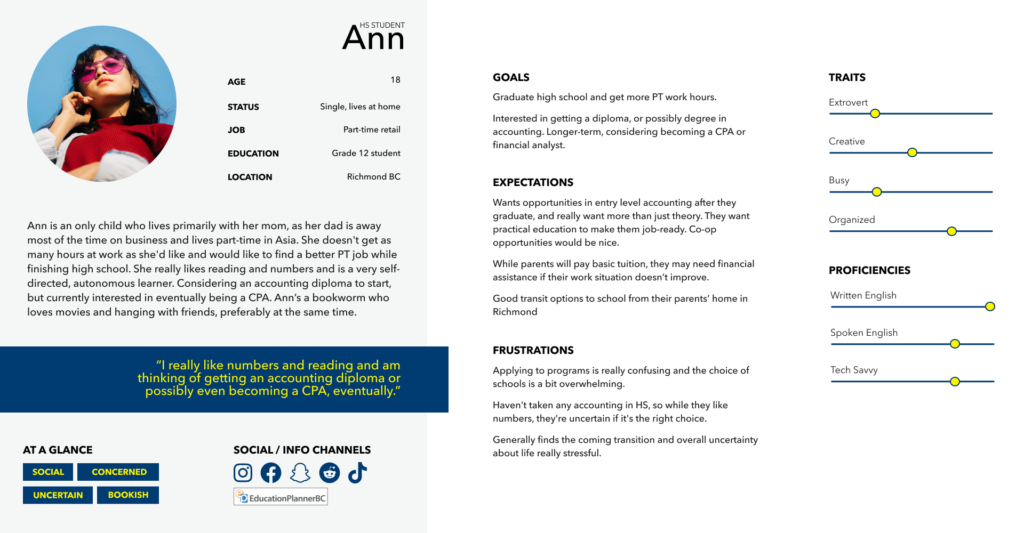
Tips for Creating Personas:
- Real data – Don’t just make stuff up.
- Collaborate – Don’t work in a vacuum, to gain acceptance for their validity.
- Quality vs Quantity – 3-5 personas is usually ideal.
- Be specific – Describe your users with sufficient detail that they become tangible.
- Socialize – Share and use them, or else they are a complete waste of time.
Journey Maps
A journey map is a visualization of the journey a customer/user takes in interacting with a product or business. They not only help you understand the customer experience, but also to identify opportunities for improvement.
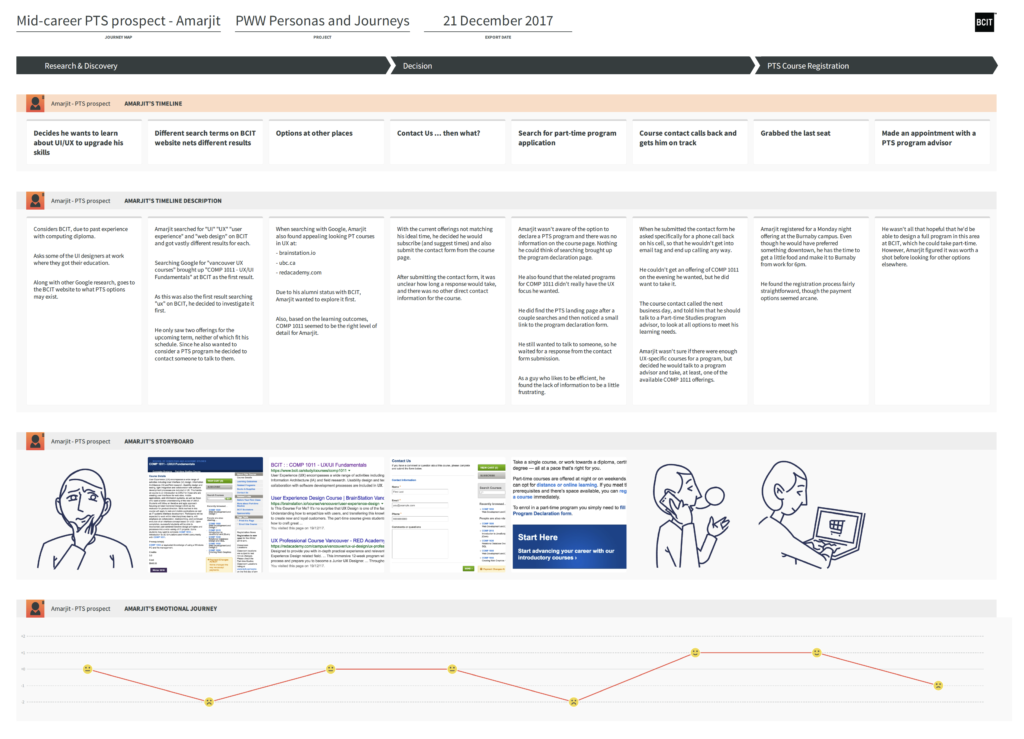
There are many ways of formatting them, but a good journey map will include the following:
- Lens – Who is the focus of this journey?
- Experience – The steps and emotional states of the journey.
- Insights – User stories, quotes, problems and opportunities.